Pakistan's LSM growth shrinks 0.4% in Q1 FY23
LSM sector, which contributes 9.2% to Pakistan’s GDP, has been showing contraction since the start of FY23
November 17, 2022

- LSM sector has been showing a contraction since the start of FY23.
- There was zero growth in LSM in September 2022.
- LSM dominates overall manufacturing sector, accounting for 74.3%.
ISLAMABAD: Large-scale manufacturing (LSM) output declined 0.4% in July-September FY23 compared to the same quarter last fiscal as costlier inputs due to rupee devaluation, high financing costs, and global slowdown took a toll.
The LSM sector, which contributes 9.2% to Pakistan’s GDP, has been showing a contraction since the start of FY23.
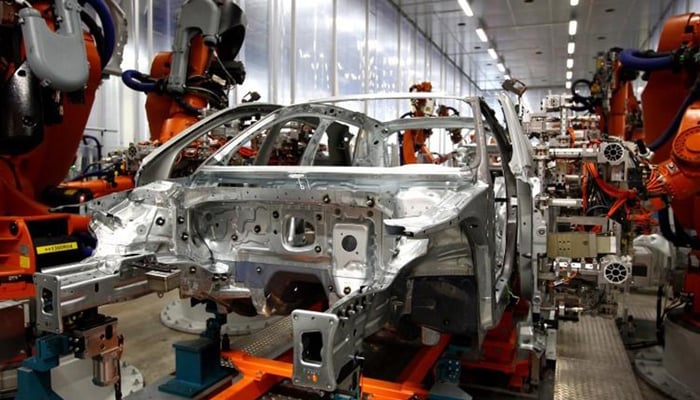
Sectors holding a significant share in LSM — including textiles, automobiles, pharmaceuticals, food, coke and petroleum products, and non-metallic minerals — registered significant declines.
There was zero growth in LSM in September 2022 against the same month a year ago; however, over the previous month, its output minutely increased i.e. 0.1%, the Pakistan Bureau of Statistics (PBS) reported on Wednesday.
It should be noted that on Monday, State Minister for Finance Ayesha Ghous Pasha told a parliamentary panel that the country’s GDP growth rate might fall short of the target by over 2% and tax collection would also get a hit.
She blamed the recent devastating floods as the reason for this slowdown; however, she did not mention the other structural issues that hindered the growth.
LSM dominates the overall manufacturing sector, accounting for 74.3% of the sectoral share followed by small-scale manufacturing, which accounts for 2% of the total GDP, and 15.9% sectoral share.
Slaughtering accounts for 1.2% of GDP with a 9.7% sectoral share. Overall, the manufacturing sector contributed 12.4% to the country’s GDP.
Since the start of FY23 in July, LSM output growth turned negative. In July 2022, LSM growth showed a negative growth of 16.5% over June 2022 and 1.4% over July 2021.
Output in July-September FY23 as compared to the same period of last fiscal has increased in wearing apparel, chemicals, iron and steel products, and furniture, while it decreased in food, tobacco, textile, coke and petroleum products, pharmaceuticals, rubber products, non-metallic mineral products, fabricated metal, electrical equipment, machinery and equipment, automobiles and other transport equipment.
A volatile rupee, high energy costs, and tighter monetary and fiscal policies also hit outputs, while slowing international demand was also one of the reasons that the sector declined.
Breakdown
In September, garments output increased 52.2%, beverages 11.6%, leather 5%, wood products 58.5%, chemicals 9.7% (of which chemical products output was down 1.9% while fertiliser was up 18.8%), furniture 54.3% and other manufacturing (footballs) output increased 69.6% over the same month of last year.
During the month, iron and steel output went down by 7%, food 3.2%, tobacco 10.8%, textiles 2.5 %, coke and petroleum products 24.4%, pharmaceuticals 22.5%, rubber products 13.9%, non-metallic-mineral-products output 1%, fabricated products 24.6%, computer, electronics, and optical products 18.4%, electrical equipment 2%, machinery and equipment 34.1%, automobiles 32.8% and other transport equipment production reduced 43.2% as against the same month of last year. Cement production also declined by 1.5%.
While comparing the outputs of July-September FY23 with FY22, beverages output increased 3%, garments 58%, leather 8.4%, wood products 23.5%, chemicals 4.1% (with chemical products up 6.9% and fertilisers 2.2%). Besides, Iron and steel products output increased by 4.9%, furniture 12.6%, and other manufacturing (football) 59% over the same period a year ago.
Food output declined 6.2%, tobacco 31.2%, textiles 3.3%, coke and petroleum products 18.9%, pharmaceuticals 29%, rubber products 7.1%, non-metallic mineral products 13%, fabricated 18.7%; computer, electronics, and optical products 9.6%, electrical equipment 3.5%, machinery and equipment down 37%, automobiles 2.6%. Besides, the output of other transport equipment declined 42.2% over the same period last year.
Originally published in The News


